STRICT mTLS and Prometheus cannot both be right
Every scrape target sat DOWN with "connection reset by peer" while the endpoint answered 200 from inside the pod. Nothing was broken — the mesh was enforcing exactly what it had been told to. It took four attempts to fix it without giving up the control, and the fix broke something two files away.
I had STRICT mutual TLS across the application namespace. One short manifest:
apiVersion: security.istio.io/v1beta1
kind: PeerAuthentication
metadata:
  name: default
  namespace: webapp-prod
spec:
  mtls:
    mode: STRICT
Every pod-to-pod call inside that namespace is now mutually authenticated, with workload certificates Istio issues and rotates. Identity-based access control between services, for the cost of nine lines.
Then Prometheus could not scrape anything.
Get "http://10.42.0.51:8000/metrics": read tcp …->10.42.0.51:8000:
read: connection reset by peer
Every api and web target DOWN. Meanwhile, from inside the pod:
kubectl exec api-v1-… -c api -- \
  python3 -c "import urllib.request; print(urllib.request.urlopen('http://localhost:8000/metrics').status)"
# 200
The application was fine. The sidecar was rejecting a plain-HTTP connection, because I had told it to reject plain-HTTP connections.
The shape of the problem
Prometheus is not in the mesh, so it has no workload certificate to present. Under STRICT, the sidecar in front of every pod refuses any connection that does not arrive as mutual TLS — including the scrape.
The obvious fix is to drop PeerAuthentication to PERMISSIVE. It works, it takes one line, and it quietly throws away the control — because port 8000 carries application traffic as well as /metrics. Exempting the port exempts everything.
I wanted to keep STRICT.
Four attempts
Attempt 1 — scrape the app port. Targets appeared and sat DOWN. Correct diagnosis of the symptom, wrong layer for the fix.
Attempt 2 — ServiceMonitor with targetPort: 15020.
Istio’s sidecar republishes the application’s metrics merged with Envoy’s on port 15020, and keeps that port outside mTLS so monitoring survives. So point the ServiceMonitor at it.
The targets vanished entirely.
That felt like a regression and was in fact a step closer. A ServiceMonitor discovers through the Service’s Endpoints, so its targetPort can only select a port the Service exposes. Mine exposed only 8000, so nothing matched, and the job disappeared from Prometheus altogether.
This is the attempt worth remembering. A failing target tells you something is wrong. A missing target looks like you never created the monitor. Going from “eight targets down” to “no targets at all” felt like going backwards.
Attempt 3 — PodMonitor with targetPort: 15020. A PodMonitor discovers pods directly, so surely it can reach a pod port.
Also zero targets. The clue was in the operator log:
level=warn msg="'targetPort' is deprecated, use 'port' instead."
      pod_monitor=webapp-prod/api-v1
Both forms compile down to a relabel that keeps only declared container ports. Port 15020 listens, but Istio does not declare it as a containerPort. (15090 is declared, as http-envoy-prom — but it serves Envoy’s metrics only, without the application’s.)
Attempt 4 — publish 15020 as a Service port.
ports:
  - name: http
    port: 8000
    targetPort: http
  - name: tcp-metrics        # not named http-*, deliberately
    port: 15020
    targetPort: 15020
A Service will forward to any pod port, declared or not. That is the one property neither monitor CRD has. The ServiceMonitor then attaches to the named Service port, and it works:
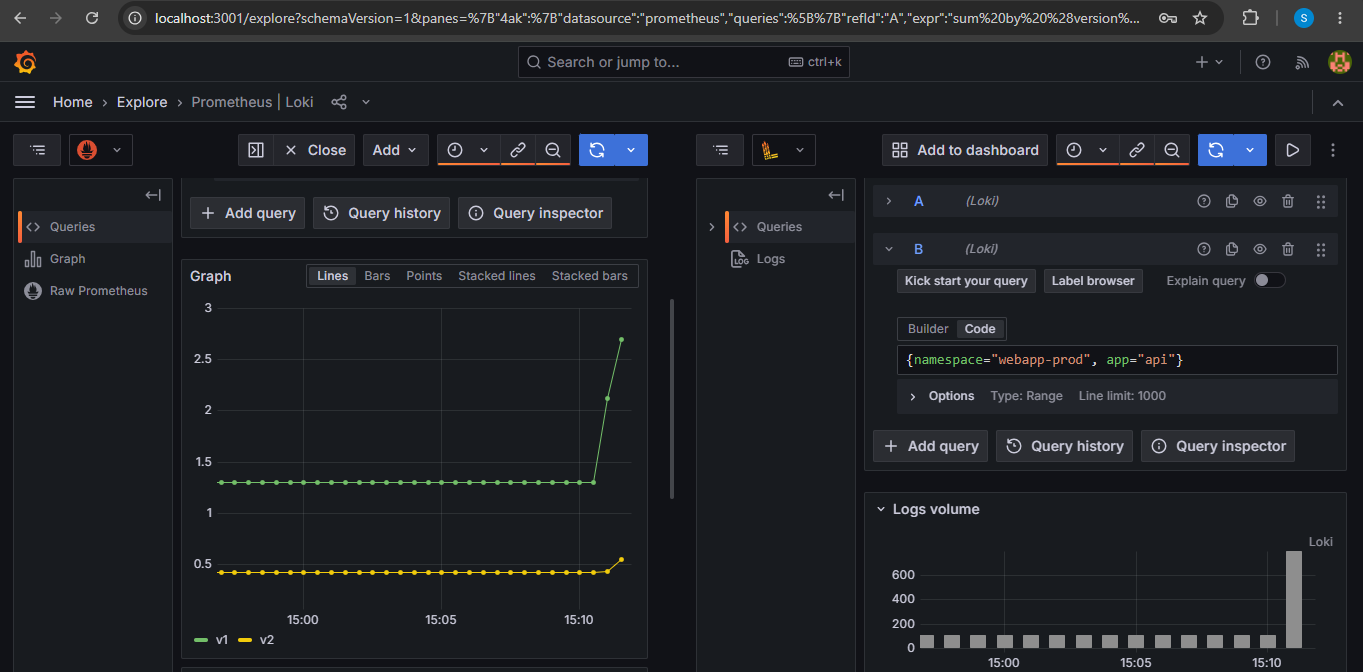
OK api  8/8 up
OK web  2/2 up

http_requests_total{service="api",version="v1"}  1280
http_requests_total{service="api",version="v2"}   326
STRICT mTLS kept. And istio_requests_total arrives for free, because the merged endpoint carries Envoy’s metrics too.
The port is not named http-*, on purpose. Istio infers the protocol from the port name, and this one carries Prometheus exposition format — not application HTTP that should be routed or retried.
The annotations that make the merge work
One detail that cost a cycle: the sidecar only merges an endpoint it has been told about. Without these on the pod template, 15020 serves Envoy’s metrics only.
annotations:
  prometheus.io/scrape: "true"
  prometheus.io/port:   "8000"
  prometheus.io/path:   "/metrics"
You can confirm it took effect by reading them back off a running pod — Istio rewrites them to point at itself:
prometheus.io/path = /stats/prometheus
prometheus.io/port = 15020
prometheus.io/scrape = true
The fix broke something two files away
This is the uncomfortable part. Publishing 15020 made the api Service multi-port — and a VirtualService destination that points at a multi-port Service no longer identifies a port.
Nothing failed. The canary kept routing, ArgoCD stayed Synced and Healthy, every pod stayed Running. The only trace was a validation counter in Kiali, easy to mistake for the deliberate errors I was generating at the time, and — on asking —
Error [IST0112] … routes to a service that exposes multiple ports [8000 15020].
Specifying a port in the destination is required to disambiguate.
port.number: 8000 on all three destinations cleared it. But nothing in the normal feedback loop would have caught it: ArgoCD reports sync and health, not semantic validity. Only istioctl analyze checks mesh configuration for meaning — which is why it belongs in the release loop, not run as an afterthought.
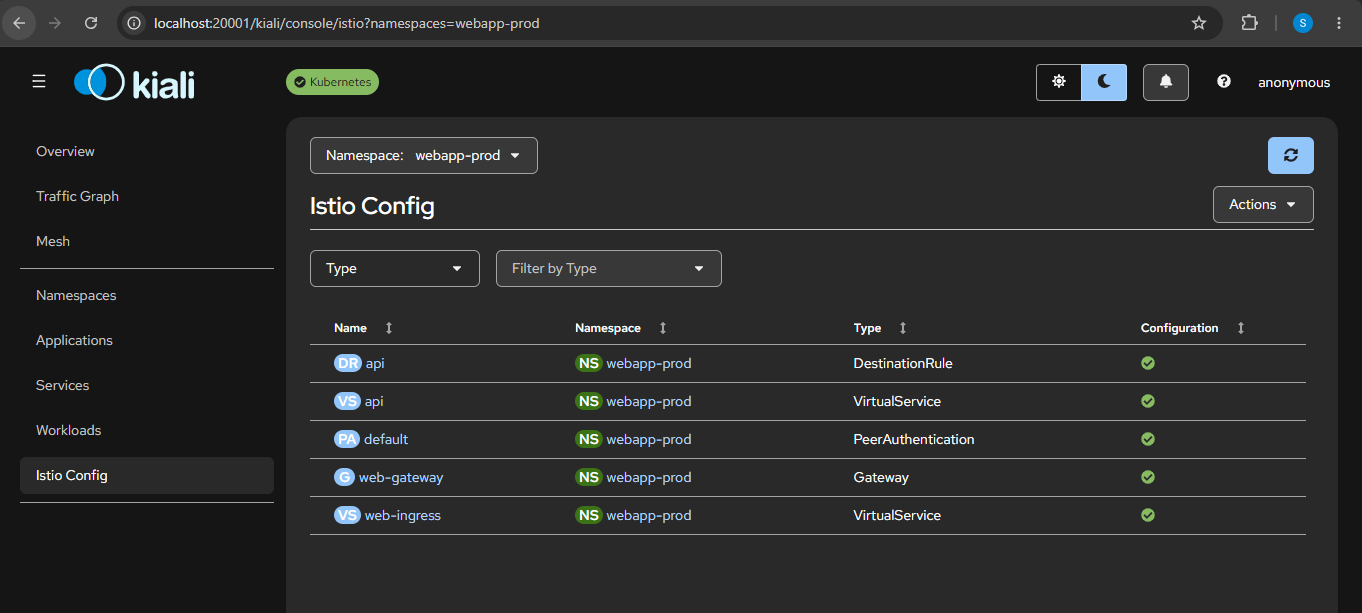
PeerAuthentication that was kept rather than relaxed.And the honest footnote
The genuinely correct answer is a third thing none of my four attempts did: serve /metrics on its own port. Then the app port stays STRICT, only the metrics port is exempted, and nothing depends on Istio’s merge behaviour.
That is an application change — a second listener — and I did not make it. The fix I shipped works and keeps the control, but it is not the ideal one, and saying so costs nothing.
What I took from it
- A security control doing its job looks exactly like a bug. Nothing was broken. The first useful question was not “what is wrong” but “what did I tell it to do”.
- Progress can look like regression. Attempt 2 made the symptom worse and was closer to the answer. Judge a change by what it taught you, not by whether the dashboard got greener.
- A missing target is a worse symptom than a failing one. Absence reads as “not configured”; failure reads as “configured and wrong”. Prefer tools that fail loudly.
- Know what your discovery mechanism can actually select. Both ServiceMonitor and PodMonitor filter on declared ports. A Service does not. That one asymmetry was the whole solution.
- Be suspicious of a green dashboard right after a change in an adjacent layer. The fix was correct, tested and verified — and quietly created a fault in a file nobody had touched.
- Take the fix that keeps the control, or write down which one you gave up.
PERMISSIVEwould have worked in one line. It would also have silently deleted the reason the namespace had mTLS at all.
From the GitOps delivery platform build.
References
- Istio: PeerAuthentication —
STRICTversusPERMISSIVE. - Istio: Prometheus — metrics merging — the merged endpoint on
:15020/stats/prometheus, and theprometheus.ioannotations it overwrites. - Istio: protocol selection — why the port name decides how traffic is treated.
- Istio: IST0112 — a destination on a multi-port service must name the port.
- Prometheus Operator API —
ServiceMonitorandPodMonitorendpoint selection.