Production system at a previous employer. The screenshots are real, with IP addresses and the control node's hostname redacted; the server names in them are internal labels.
The problem
Every server in the fleet had a record saying what it was — typed in once, when it was provisioned, and never checked again. Finding out what a machine actually was meant logging in and looking: how many cores, how much memory, spinning disk or SSD, how good its network interfaces were. Comparing two servers meant doing that twice and hoping both answers came back in the same units.
The goal was for the platform to answer instead: which servers are strong, which are weak, and — more usefully — why.
Read-only, by design
The collector runs as root on every server, so its boundary was agreed before any code existed. It collects technical configuration — hardware, operating system, kernel tuning, limits, network interfaces, storage, package versions — and nothing else. No running processes, no user accounts, no SSH configuration, no firewall rules, no cron jobs, no application config contents, no logs, no credentials.
A tool with root on every host should be able to say exactly what it will never read.
How it works
One collector, uploaded per run. The orchestrator on the control node reads each server’s SSH credentials from the same central source the firewall orchestrator uses, connects with Paramiko, uploads the collector to /tmp with mode 0700, runs it, and parses one JSON document from its stdout. The collector is deleted in a finally block — on success and on failure. Nothing is installed on a node, and nothing is left there.
Parallel, with failures kept separate. Up to ten servers are collected at once. A server that cannot be reached fails on its own and is reported in the results, while the rest of the run carries on.
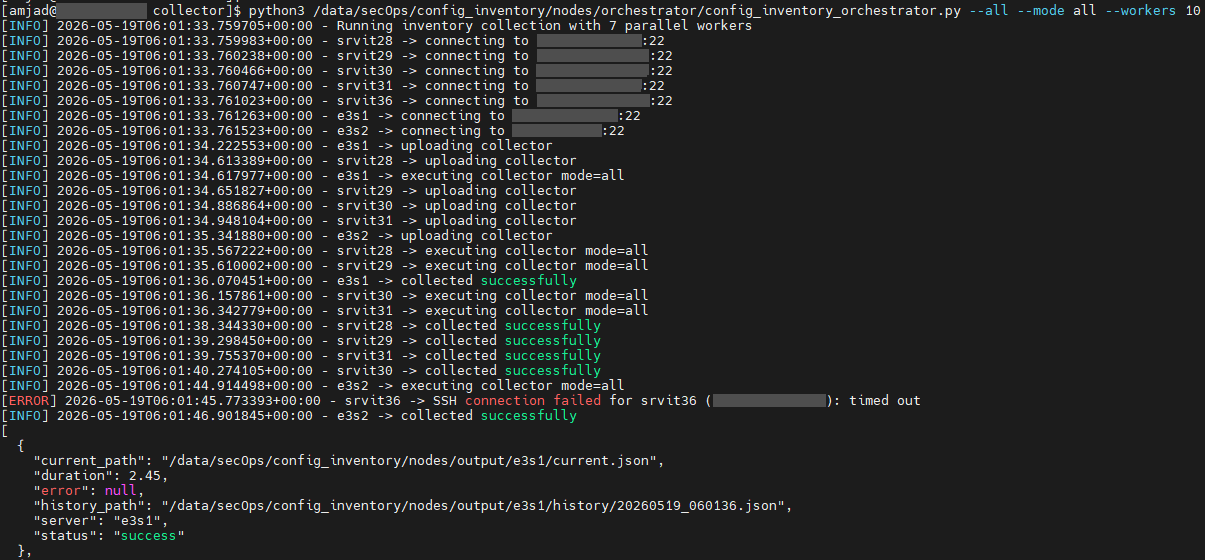
current.json and a timestamped history file. (Addresses redacted.)Current plus history. Every collection writes a timestamped history file, then replaces current.json atomically — written to a temporary file and renamed into place, so nothing ever reads a half-written file. The database follows the same shape: current tables hold one row per server, and history tables keep every snapshot.
Normalisation — one schema, one set of units
Collecting is the easy half. Sources disagree about units and formats, and a score is meaningless unless every server is measured the same way:
- CPU frequency arrives in GHz from some sources and MHz from others — always stored in MHz
- Memory arrives in kB and disks in bytes — both stored in GB
- Disk type comes from the transport (NVMe) or the kernel’s rotational flag (SSD or HDD)
- NIC speed comes from sysfs, falls back to
ethtoolwhen sysfs has nothing — and when a virtual NIC reports no speed at all while it is up, 1 Gbps is assumed and the value is taggedvirtualized_fallback, so the assumption stays visible instead of silently becoming data - Package versions are parsed from each tool’s own version banner into a semantic version and split into major, minor and patch — so “which servers run nginx older than 1.26?” is a query, not a grep across a fleet
Scoring — two levels, every point explained
Each network interface is scored by the collector itself, and each server by the ingestor. Both start at 100 and lose points for specific, named reasons.
| Network interface | Points |
|---|---|
| Speed unavailable / below 1 Gbps | −20 / −25 |
| Duplex not full / unknown | −20 / −5 |
Legacy driver (e1000, rtl8139) | −15 |
| A single combined queue | −10 |
| Each of TSO, GSO, GRO, TX checksumming disabled | −5 |
| Error counters above zero | −15 |
| Drop counters above zero | −10 |
| Server | Points |
|---|---|
| Fewer than 4 / 8 CPU threads | −20 / −10 |
| Less than 4 / 8 / 16 GB RAM | −25 / −15 / −5 |
| Virtualised | −10 |
| Primary disk HDD or unknown / NVMe | −20 / +5 |
| Average NIC score below 60 / 80 | −20 / −10 |
Every deduction writes a sentence into the result — “Low RAM”, “Non-SSD primary storage”, “Legacy/less optimal NIC driver detected: e1000”. That is the useful part. A grade tells you a server is weak; the notes tell you what to change.

e1000 ports score 80, grade B — 15 of that for the legacy driver — and the notes column carries every reason. Unused ports that are down lose points for a speed they cannot report.A dictionary for metrics nobody planned for
Network drivers do not agree on what they report. ethtool exposes different offload features and channel parameters depending on the NIC, so there is no fixed list to write down in advance.
So the list is not fixed. When a collection contains a metric the platform has never seen, it is registered automatically in a metrics dictionary — category, subcategory, data type and an example value — and it arrives unapproved. It is visible from the first sighting, but it does not become part of the vocabulary until someone reviews it. Registration is insert-if-absent, so later sightings never overwrite a decision that has already been made.
That review step is what stops a self-extending schema from turning into a pile of near-duplicate names.
Writing back to the master record — deliberately separate
The inventory’s own tables are written on every run. The fleet’s master servers table — the record other systems read — is different. It is only updated when a run explicitly asks for it with --sync-server-profile, and every synced row is stamped with when it was synced. The whole ingestion is one transaction: it commits entirely or rolls back entirely.
And the sync refuses to run from partial data.

In production
Scheduled daily at 03:30 UTC for every server, under flock so a slow run can never overlap the next, with the sync enabled — approved by my team lead on 15 September 2026.

Why it matters for security
It was scoped as a technical inventory, not a security collector — deliberately. But an accurate, current inventory is still what security work stands on. You cannot protect a fleet whose contents you have to guess, and with every package version parsed and stored per server, “which hosts are running a vulnerable version of this?” becomes a query with an answer rather than an afternoon of SSH.
What the data showed, and what I would change
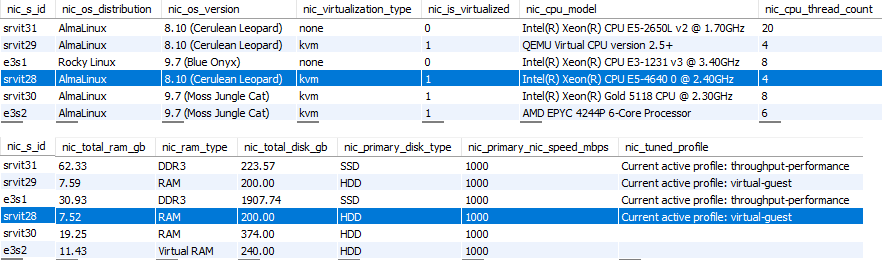
On a VM, “HDD” means “the guest was told it is rotational”. Virtual disks commonly report themselves as rotational unless the hypervisor says otherwise, so every KVM guest’s primary disk classified as HDD — and each VM lost 20 points for non-SSD storage on top of the 10 it had already lost for being virtualised. The collector reports what the guest kernel sees, and on a virtual machine that is not what the host has. Virtual storage should be its own class, not scored as spinning disk.

virtual, model 0x1af4, the virtio vendor ID — comes through as HDD.The thresholds are judgement, not measurement. The deductions are sensible, but nobody calibrated them against how the servers actually perform under load. Until a grade is shown to predict throughput, it is a well-reasoned heuristic — and the honest next step is to correlate grades with measured workload behaviour and adjust the weights to match.
Assumptions should be scored as assumptions. The 1 Gbps fallback for silent virtual NICs is tagged, but it still flows into the score like a measurement. A value that was assumed should either be excluded from scoring or carry its own flag through to the grade.
Built on the firewall platform’s patterns
This deliberately reused what already worked on the firewall platform: the same Paramiko orchestration, the same central credential source, the same configuration loader, and the same versioned output plus current pointer for results. A second system built the same way is a second system someone else can operate.