Production system at a previous employer. The screenshots are real, with IP addresses and the control node's hostname redacted. I owned the orchestrator, node deployment and diagnostics; the dashboard and the Windows-side API layer belonged to colleagues.
The problem
The same proxy can pass from one server and fail from another. Routing differs, geography differs, and a proxy vendor may have authorised one egress address and not the next. So “is this proxy working?” is not really a question about the proxy — it is a question about the proxy from a particular place.
That difference is the whole product. A user picks a proxy and a server on a dashboard, and gets back connectivity and speed measured from that server.
The original version picked up checks from cron, once a minute, so a user who clicked check could wait up to sixty seconds before anything happened at all. Failures came back as raw Python exception strings. And there was no quick way to tell whether a failed check meant a bad proxy or a broken node.
How it works
From cron to a daemon
I replaced the cron job with a long-running systemd service:
- ~2-second pickup instead of up to 60 — it polls every two seconds, claims up to 100 jobs and runs 10 workers concurrently
- Graceful drain on
SIGTERM, so a restart finishes the batch in flight rather than stranding it - Stale-job reclaim — anything stuck in
runningfor more than 15 minutes goes back in the queue - Exponential backoff on database errors, rather than a tight retry loop hammering a database that is already struggling
- Single-instance locking on the same lock file the old cron entry used — so the daemon and any surviving cron line can never run at the same time. The old cron entries were commented out, not deleted.
Rollback is one file copy and a restart, because the daemon holds no state outside the database.
Three config values that fail silently
The code was not where the risk was. Three values in the unit file each break something without a single warning:
| Setting | Correct | What the wrong value does |
|---|---|---|
| batch size | --limit 100 | A draft carried --limit 10 — a tenfold throughput cut that nothing reports |
TimeoutStopSec | 300 | A 100-job batch of speed tests needs time to drain; a short timeout strands jobs mid-run |
PrivateTmp | absent | The lock file lives in /tmp and is shared with the legacy cron line on purpose. PrivateTmp=yes gives the daemon its own /tmp — and quietly removes the guarantee that the two never overlap |
The --limit 10 was caught in review, not in production. The lesson I wrote into the handover: diff every configuration value on a rebase, not just the code.
Failures that say where they failed
Every failure now names the stage it failed at, and raw exception text is normalised — <urlopen error Tunnel connection failed: 407 Proxy Authentication Required> becomes 407 Proxy Authentication Required.
| Stage | Meaning |
|---|---|
endpoint | could not work out where to send the check |
node | could not reach the server at all — DNS, refused, timeout |
api | the server answered with an HTTP error — bad key, not routed, backend down |
proxy | the check ran; the proxy or the target refused |
local | control-node run; the tool itself would not start |
That table separates two problems the team kept conflating. “Node DNS lookup failed” is a routing problem on our side. “407 from this node” is the proxy vendor rejecting authentication, and has nothing to do with the fleet. Without the stage, both read as “the check failed”.

9999) gives connection refused, wrong credentials give 407, and an unroutable documentation-range address times out after 30 seconds. The 502s are a different stage entirely — the node's own API layer failing. Every one of these arrived as raw exception text; this is what the stage names replaced. (Egress addresses redacted.)Keeping the proxy password off the process list
A proxy check needs the proxy’s credentials, and a command line is readable by every user on the machine through ps. So the payload travels on stdin on every path — PHP hands it to the tool through proc_open, the control node passes it to a subprocess the same way — and stored results mask the credentials before they are written back.
One bug from this is worth recording because it cost two debugging sessions. Placeholder text — <USERNAME>, <PASSWORD> — left inside a JSON test payload was URL-encoded into the proxy string, and came back as a perfectly plausible 407. It looked exactly like the vendor rejecting us. The rule since: never put a placeholder inside a payload; pull real test credentials from the database so nothing is typed at all.
A health check that proved the wrong thing
The node installer used to exit 0 once it had copied the files. The node’s health endpoint returned a fixed string without running any Python — so it proved that the request was routed, not that the checker could actually run.
The installer now finishes with two checks: a fatal import of the core module under the real interpreter, and a loopback probe of the health endpoint. It also resolves the interpreter by asking it its version rather than trusting its filename, and refuses anything older than Python 3.13.
That version rule was not my first position — I argued for tolerating any version, because the Windows machines varied. My team lead overruled it, and the concern turned out not to apply: the installer only ever runs on the Linux nodes.
Making the fleet legible
“Checks are failing” is not a diagnosis. Two sweeps turned it into one.
Linux nodes. A loop over every node, reading the API key from the deployed configuration so nothing is typed, maps each result to a cause: no DNS record, nothing answering, route missing, key mismatch, or healthy. At handover, every Linux node was healthy.

Windows VMs. The check route is POST-only, so the probe sends a GET — and reads HTTP 405 as a pass. A 405 proves the API layer is up and the checker’s router is mounted. A 404 means the API is up but the router is not. No response means nothing is listening.
That probe found the largest single cause of failed checks in the whole system, and it was not in the checking code: 13 of 18 Windows machines had nothing listening at all, because the service that starts the API layer was being started by hand and did not survive a reboot. Starting it reliably was separate work, already assigned when I handed over.
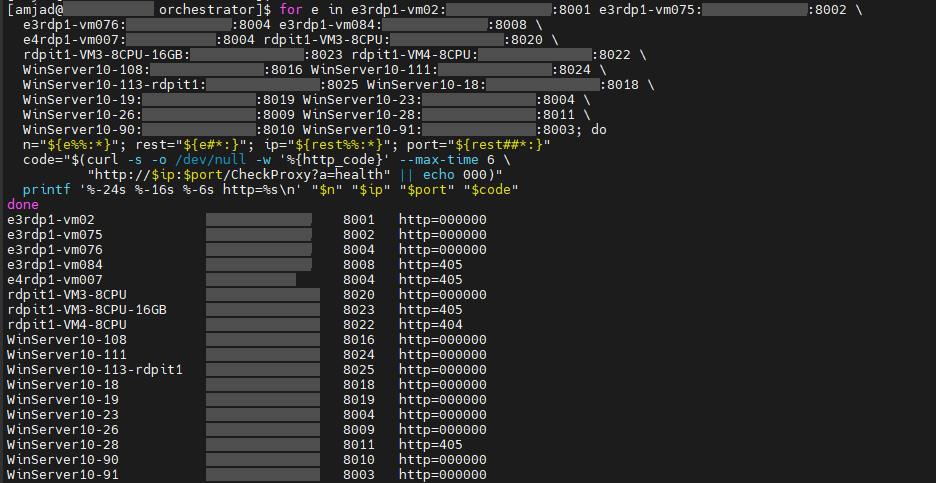
405 is the pass — the route exists and only accepts POST. 404 means the API is up but the checker isn't mounted. 000 means nothing answered at all, and that was thirteen of eighteen. (Addresses redacted.)The most common error message had a different cause, and it was data, not infrastructure. Jobs for Windows machines were being queued with the flag that marks them as Windows machines unset — so the daemon built a Linux node hostname for them, which did not exist, and reported node DNS lookup failed. Most “broken node” reports resolved to a queue row sending the check down the wrong branch.

0, so the daemon built a Linux node hostname for it — which does not exist — and every attempt failed on name resolution. The node was fine; the row was wrong. (This predates the switch to a single attempt.)One exact bug
The dashboard showed speeds that were consistently low. The cause was a unit: it displayed KiB/s labelled as Mbps.
1 KiB/s is 1,024 bytes per second, which is 8,192 bits per second — so every speed was under-reported by exactly 8.192×. An exact, constant ratio is never a network problem; it is always a units problem. After the dashboard-side fix, 49.99 and 26.89 Mbps matched the node’s own measurements.
Trade-offs, and who made them
Two behaviours look like bugs and are deliberate — both my team lead’s decisions:
A verdict is written on every completed check, including one that never reached the proxy because the node was down. Leaving those rows at to-check would have the system re-check them forever. The cost is that a node outage marks healthy proxies as down. The dashboard compensates by showing the last-checked server, status and time together, so a verdict can be read in context. An earlier version skipped the write when the node was unreachable; if the debate ever reopens, that is the guard to restore.
No automatic retries. A failed check surfaces to the user, who can re-queue it, rather than being retried silently. Retries would hide exactly the per-node failures the tool exists to show.
What I got wrong
I spent days editing the wrong file. There were two similarly named copies of the orchestrator, and I worked in one for several sessions before a grep of /etc/cron.d showed that the live one was elsewhere. The first thing I now do on an unfamiliar system is ask systemd and cron what is actually running — before opening an editor.
Two smaller ones that are easy to repeat:
rowcountreports rows changed, not rows matched. AnUPDATE … SET x = xreports 0 and proves nothing about whether the row exists.- A query result may predate the deployment you are testing. Select the finish timestamp and compare it with the restart time, or you can “verify” a fix against results the old code produced.
At handover
- Local execution for control-node checks was deployed but not yet exercised in production. A check aimed at the control node used to go out through DNS, nginx and PHP only to arrive back at a script on the same disk; it now runs as a local subprocess, payload on stdin. Testing it was the first item in my handover.
- Windows startup automation — the 13 silent machines — was separate work, already assigned.
- The data bugs on the dashboard side were documented, with the affected machines and the queries to find them, and handed to the developer who owns that code.
What I would do differently
Health checks that exercise the real path. A fixed-string health endpoint proves routing and nothing else. It should import the core and run a no-op check, so that “healthy” means “can actually do the job”.
Reject bad jobs at enqueue. A Windows machine queued as a Linux node should be refused by the dashboard, not discovered afterwards through a DNS failure.
Per-node, per-stage success rates as metrics. Everything the two sweeps revealed should have been on a dashboard, so that the 13 silent machines were a red row on day one rather than a finding.