HTTP 405 was the healthy answer
"Checks are failing" is not a diagnosis. Two fleet sweeps turned it into one — including a probe where Method Not Allowed meant everything was fine. The biggest cause of failed checks was not in the checking code at all.
The proxy checker tests a proxy from a particular server: a user picks a proxy and one of the fleet’s machines — Linux nodes, or Windows virtual machines — and gets back connectivity and speed measured from there. When I took it over, the standing complaint was simple: checks are failing.
That sentence covers at least five different problems. The proxy might be dead. The vendor might be rejecting our credentials. The server we asked might be unreachable. Its API layer might be down. Or our own code might be broken. Each one needs a different person to fix it, and from the dashboard they all looked the same.
Before touching the checking code, I wanted the fleet to be legible.
A health check that proved the wrong thing
The Linux nodes already had a health endpoint. It returned a fixed string — without running any Python at all. So a 200 from it proved that nginx routed the path and PHP answered. It did not prove that the checker could run: a broken interpreter, a missing module or a bad deployment would all have been reported healthy.
The node installer had the same shape. It exited 0 once it had copied the files.
Both changed:
- The installer now ends with a fatal import of the core module under the real interpreter, then a loopback probe of the endpoint. If the checker cannot start, the install fails there, not on a user’s first click.
- It finds that interpreter by asking it its version, not by trusting its filename, and refuses anything older than Python 3.13. (I argued at first for tolerating any version, because the Windows machines varied. My team lead overruled that, and the concern turned out not to apply — the installer only ever runs on the Linux nodes.)
A health check should answer can this do the job? One that answers did the request arrive? is a routing test with a reassuring name.
Sweep one: the Linux nodes
A loop over every node, reading the API key from the deployed configuration so that no secret is ever typed, and mapping each result to a cause:
| Result | Meaning |
|---|---|
DNS MISSING | no record for the node’s API hostname — an infrastructure item, not a deployment one |
http=000 | the name resolves, but nothing answered — nginx down, or a firewall |
http=404 | the checker’s path is not routed on that node |
http=401 | installed, but the API key does not match |
http=200 + "ok":true | working |

The sweep settled one argument on its own. A fault in nginx had been predicted behind an error one node was returning; the health endpoint returned 200 and disproved it before anyone spent an afternoon on it. A sweep that takes ten seconds is cheaper than a hypothesis that takes a day.
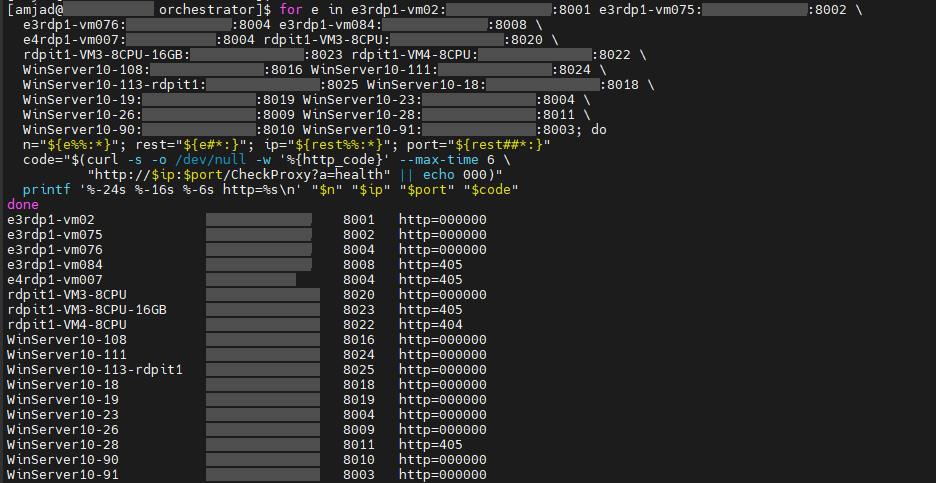
Sweep two: the Windows machines, where 405 is a pass
On the Windows virtual machines, the checker is a route inside a FastAPI application, and the route only accepts POST. A real POST is a real proxy check — slow, and it needs credentials. For a fleet sweep I wanted something cheaper that still told me what I needed.
So the probe sends a GET, and reads the answer like this:
405 is the pass. A server returns Method Not Allowed when the path matches a resource it has but the method does not — so a 405 proves the API layer is running and the checker’s route is mounted. A 404 means the application is up but the checker is not part of it. No response at all — curl prints 000 when no HTTP answer arrives — means nothing is listening.
code=$(curl -s -o /dev/null -w '%{http_code}' --max-time 6 "http://$vm:$port/CheckProxy")
case "$code" in
    405) echo "$vm  ok — API up, checker mounted" ;;
    404) echo "$vm  API up, checker NOT mounted" ;;
    000) echo "$vm  nothing listening" ;;
    *)   echo "$vm  unexpected: $code" ;;
esac
The point is not the trick. It is deciding, before you run the probe, what every possible answer means — including the ones that look like errors.
The biggest cause was not in the code
Thirteen of eighteen Windows machines had nothing listening at all.
The service that starts the API layer on each machine had been started by hand, and did not survive a reboot. Every check routed to any of those thirteen failed — and that was the largest single source of failed checks in the system, bigger than any bug in the checking code. Starting that service reliably was separate work, already assigned to a colleague when I handed over.
The most common error message had a different cause again, and it was data. Jobs for Windows machines were being queued with the flag that marks them as Windows machines unset. The daemon therefore built a Linux node’s API hostname for them — one that does not exist — and reported node DNS lookup failed.

0, so every attempt went looking for a Linux hostname that does not exist. The machine was fine; the row was wrong.Most “broken node” reports resolved to a queue row sending the check down the wrong branch. The right fix is upstream: a job for a Windows machine queued as a Linux node should be refused when it is enqueued, not discovered afterwards through a DNS failure.
Make every failure say where it failed
The sweeps were a one-off. The lasting change was in the results. Every failure now names the stage it failed at, and raw exception text is normalised — <urlopen error Tunnel connection failed: 407 Proxy Authentication Required> becomes 407 Proxy Authentication Required.
| Stage | Meaning | Whose problem |
|---|---|---|
endpoint | could not work out where to send the check | ours — usually the queue row |
node | could not reach the server at all | ours — DNS, service down, firewall |
api | the server answered with an HTTP error | ours — key, routing, backend |
proxy | the check ran; the proxy or its target refused | the vendor’s, or the proxy is dead |
local | a control-node run where the tool would not start | ours |
That last column is the reason for the table. “Node DNS lookup failed” is a routing problem on our side. “407 from this node” is the proxy vendor rejecting authentication, and nothing in our fleet can fix it. Without the stage, both read as “the check failed”, and the team kept chasing one when they had the other.
What I took from it
- A health check must exercise the real path. A fixed string proves routing. Import the code, run a no-op, and let “healthy” mean “can do the job” — the same distinction Kubernetes draws between a process being alive and being ready.
- Decide what every answer means before you send the probe. Then an answer that looks like an error can be the proof you wanted.
- Sweep the fleet before debugging the code. Thirteen silent machines outweighed every bug I could have found by reading source.
- Look at the data before the infrastructure. The commonest error was a wrong value in a row.
- Name the failing stage in every error. It turns “it’s broken” into “it’s broken here”, and tells you whose it is.
This came out of the distributed proxy checker, which also covers the move from a once-a-minute cron job to a daemon with two-second pickup.
References
- RFC 9110 §15.5.6: 405 Method Not Allowed — the method is known, but not supported by the target resource.
- RFC 9110 §15.5.5: 404 Not Found
- RFC 9110 §15.5.8: 407 Proxy Authentication Required
- curl:
--write-out—%{http_code}is000when no response was received. - Kubernetes: liveness, readiness and startup probes — the same distinction between “running” and “able to serve”.